Product development
Engineering products from first principles
For an industrial manufacturer of flushing systems, we ran the hard technical stretch of product development end to end — ideating, modelling, prototyping and testing our way to a validated, standards-compliant design.
Anonymised: delivered for a Portuguese manufacturer shown here as “the manufacturer”. Figures are illustrative and carry no client data or identifying product detail.
The challenge
With the product strategy set (see the companion case study, Costing the strategy before you tool it), the flushing valve still had to be designed, prototyped and proven. The target was a demanding European standard, EN 14055, which sets acceptance windows for both the full and reduced flush volumes — governed by hydraulic effects (buoyancy, surface tension, the float’s piston effect) that are hard to predict from first principles alone. Get the mechanism wrong and it either fails the standard or over- or under-delivers water on every flush, for the life of the product.
What we did
- Ideation, modelling and prototyping — a calibrated parametric hydraulic model to steer the design, CAD iteration on a living version map, and 3D-printed prototypes tested in water within days.
- DOE, root cause and lab testing — a 2³ factorial experiment and root-cause analysis run on our own bench, then a regression model and an optimisation against the European flushing standard.
Approach
1 — Ideate, model, and prototype
We moved from problem to hardware in tight loops. We framed the functional targets — the full and reduced flush volumes required by the European flushing standard — and ideated the mechanisms to hit them.
To steer the design rather than guess, we built a parametric hydraulic model of the valve — volumes, flow rates, buoyancy, weight and timing — and calibrated it against bench measurements. The model predicts how each geometric change moves the discharge volume (raise the float, narrow a tube, shift the equilibrium point), so design decisions were made on physical insight, not trial and error.
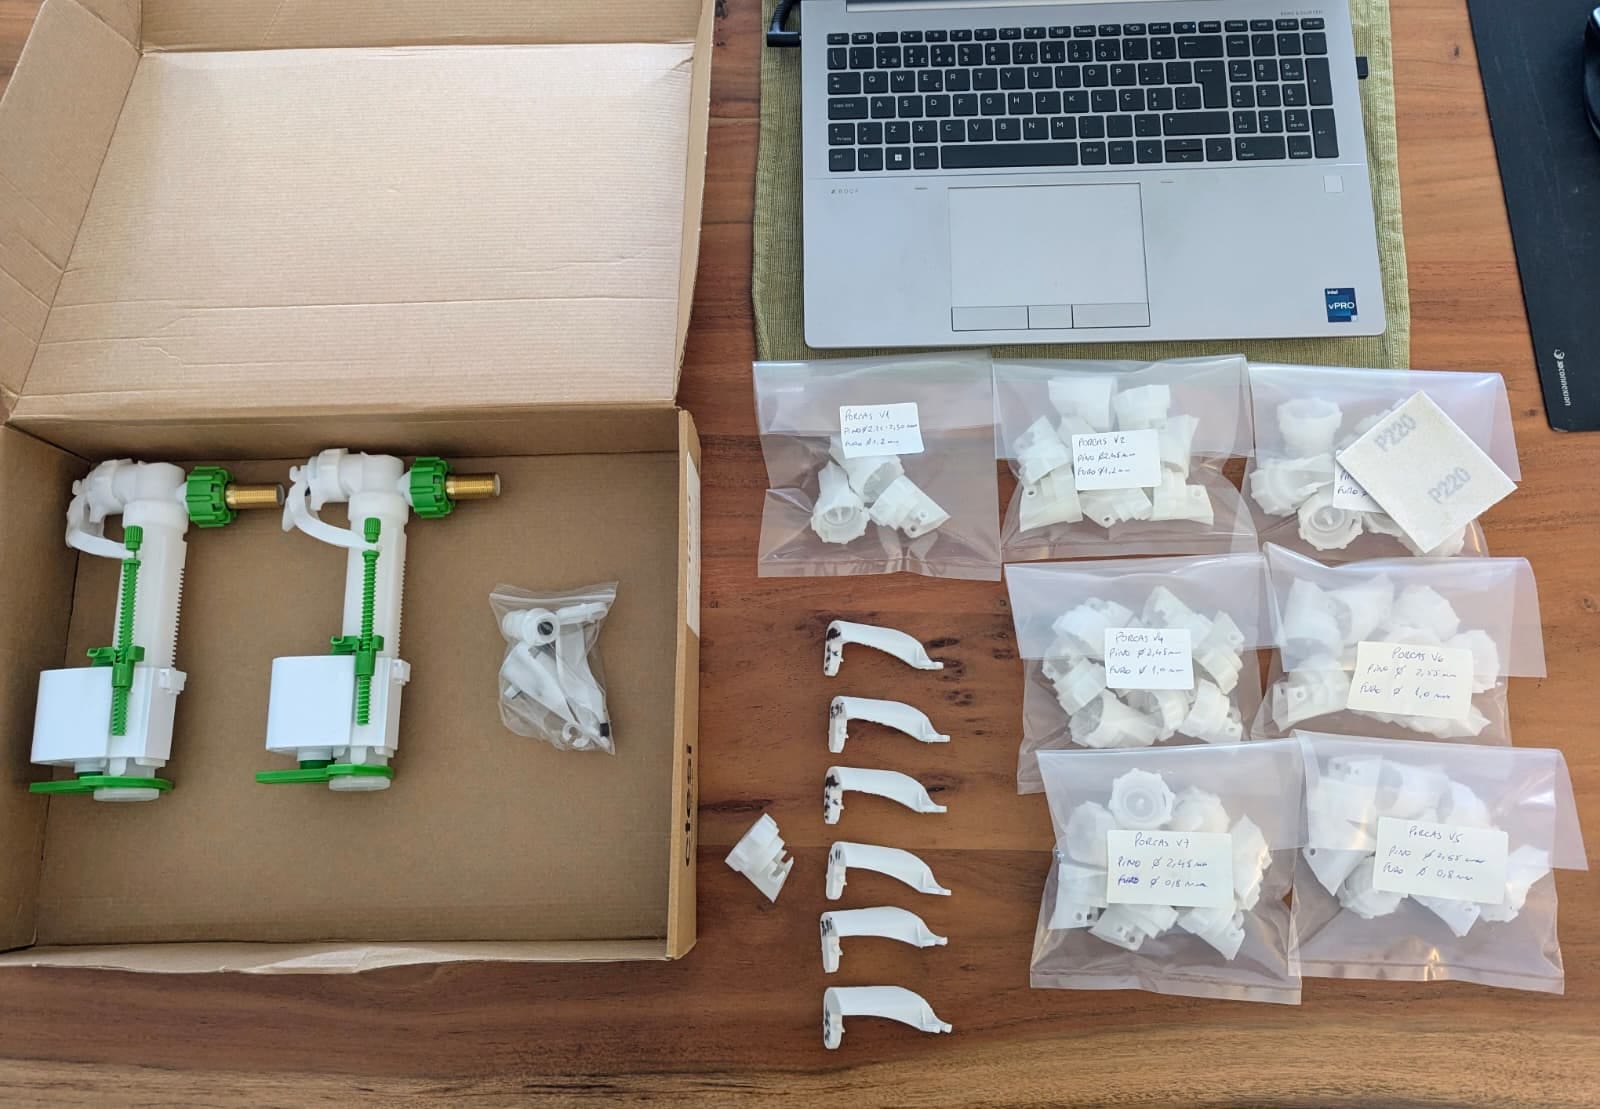
Then we iterated in CAD on a living version map and 3D-printed every candidate to test it in water within days — tube diameters, float volumes, seal cones, counterweights — keeping what worked and shelving what didn’t. Several prototype generations in, the full flush was on target and the design was consolidating toward fewer, simpler parts.
2 — Prove it: DOE, root cause, and our own bench
When early prototypes under-shot the target flush, we didn’t guess. We ran a root-cause analysis, mapping every contributor to discharge volume — flow rates, buoyancy, weight, and dynamic effects such as surface tension and the float’s piston effect — and tested the suspects one by one.
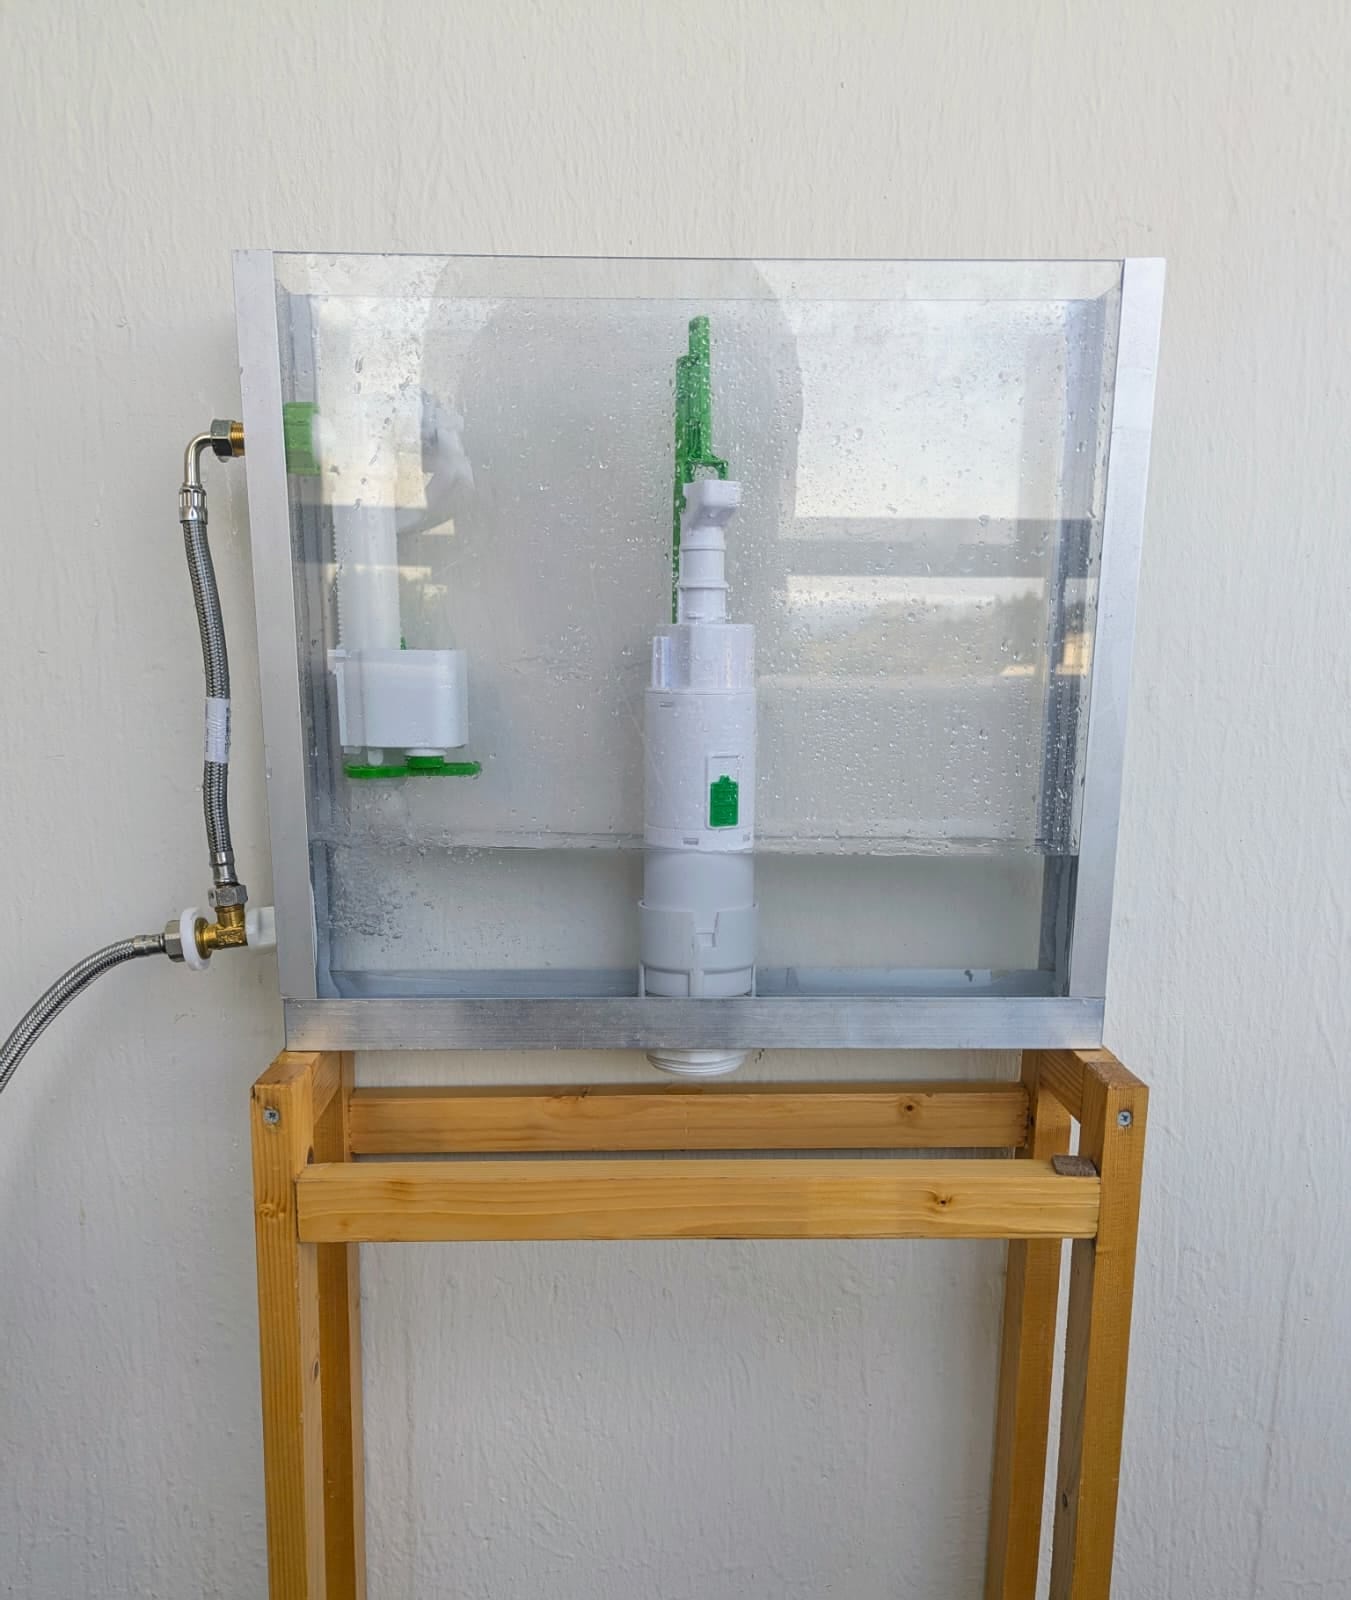
To pin down what actually controls the flush, we designed a 2³ factorial experiment — three factors (tank water level, full-flush window, reduced-flush window), eight runs — and ran every test ourselves on a bench rig, timing each flush and measuring discharged volume and flow by hand. This is the part most consultancies outsource or skip; we did the work.
Because the effects were essentially linear, we fitted a regression model — a perfect fit on the orthogonal design — and used it to run thousands of virtual flushes. Scoring each setting by its distance to the standard’s acceptance windows, a Monte-Carlo search found the regulation closest to the standard.
The payoff is a product decision: a single factory regulation can satisfy both the 6/3 L and 4/2 L variants — fewer product codes, simpler assembly, and a path to removing the adjustment windows altogether.
Outcome
We carried the chosen product to a validated, standards-aligned prototype, and left the manufacturer with a calibrated model that lets them optimise regulations without returning to the bench. This engineering work followed directly from an earlier techno-economic analysis that selected the product strategy — see the companion case study, Costing the strategy before you tool it.